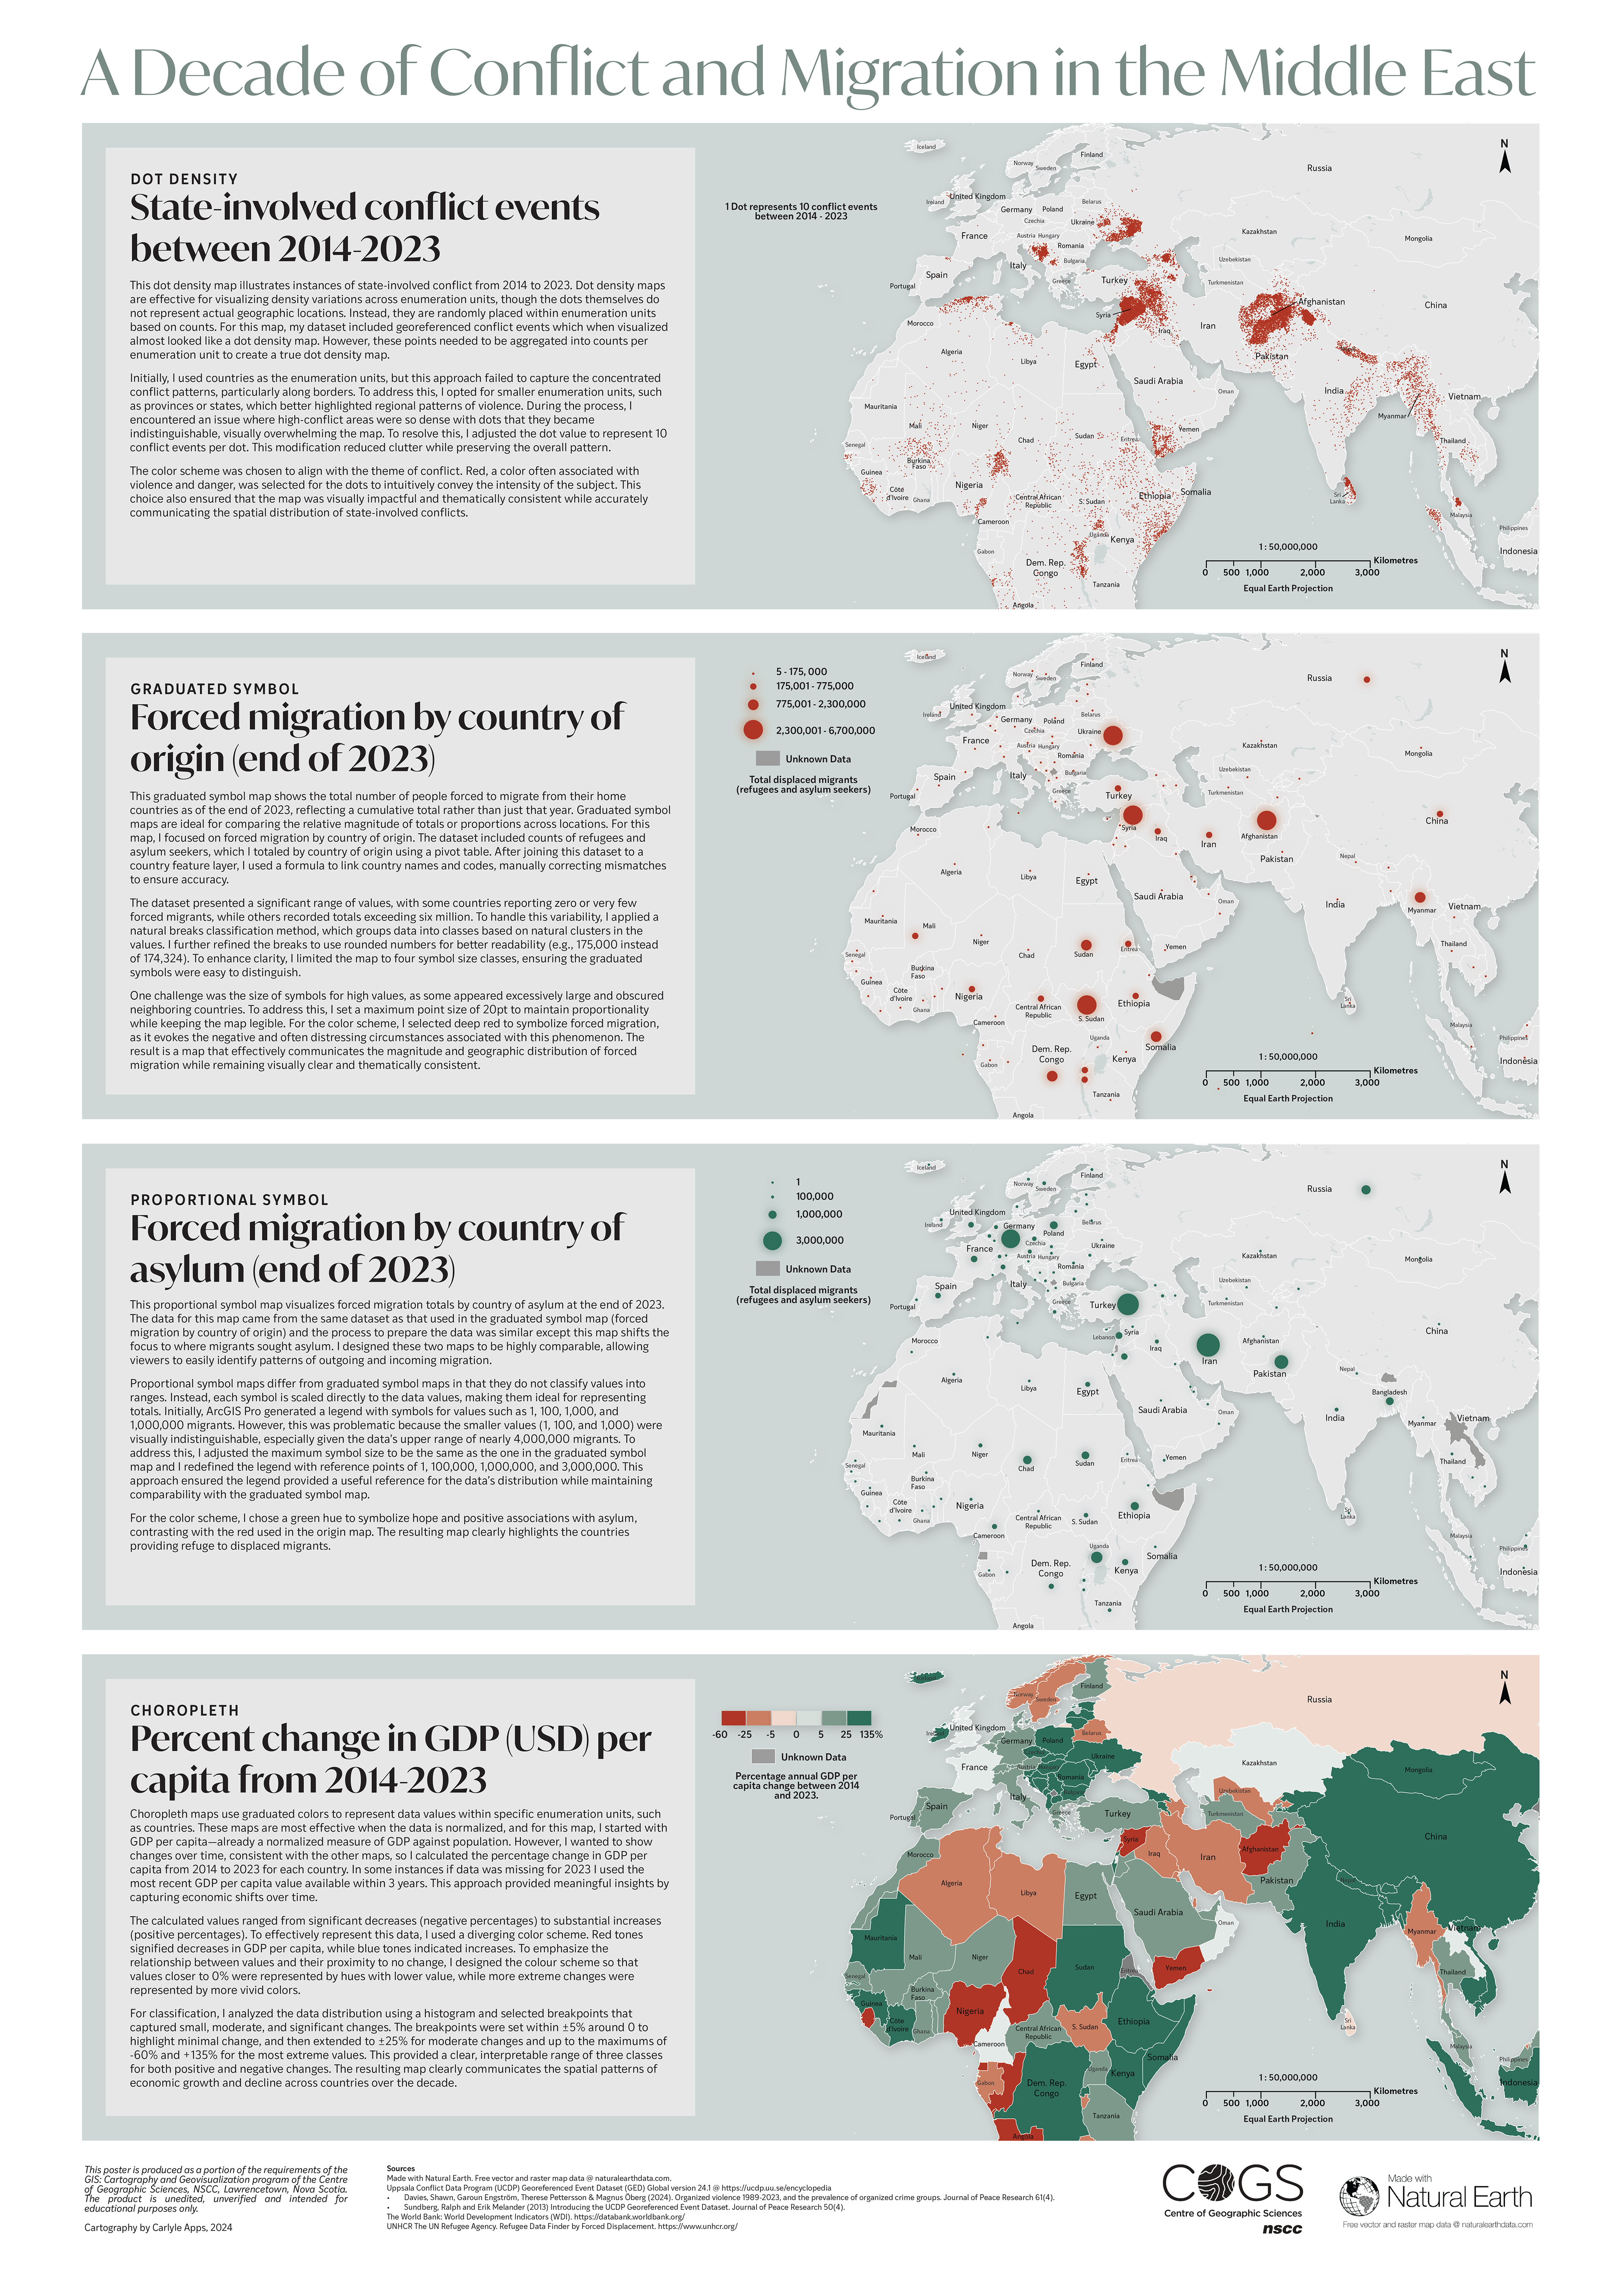
Thematic statistical mapping poster showcasing four statistical maps - dot density, graduated symbol, proportional symbol and choropleth. Conducted data acquisition, processing and visualization, applying correct symbology for each map type. Further customized the design in Adobe Illustrator including use of custom legends and a descriptive paragraph for each map.
Software / Tools: Microsoft Excel, ArcGIS Pro, Adobe Illustrator