This project explored ArcGIS Online as a platform for interactive data visualization and storytelling. Starting with a dataset of global volcanic eruptions, a hosted feature layer was created and styled in a web map. That map became the foundation for an interactive dashboard, designed to respond dynamically to user selections and filter across visualizations. To tie everything together, the dashboard was embedded into a Story Map, turning the data into a narrative.
Software / Tools: ArcGIS Online, ArcGIS Dashboards, ArcGIS StoryMaps
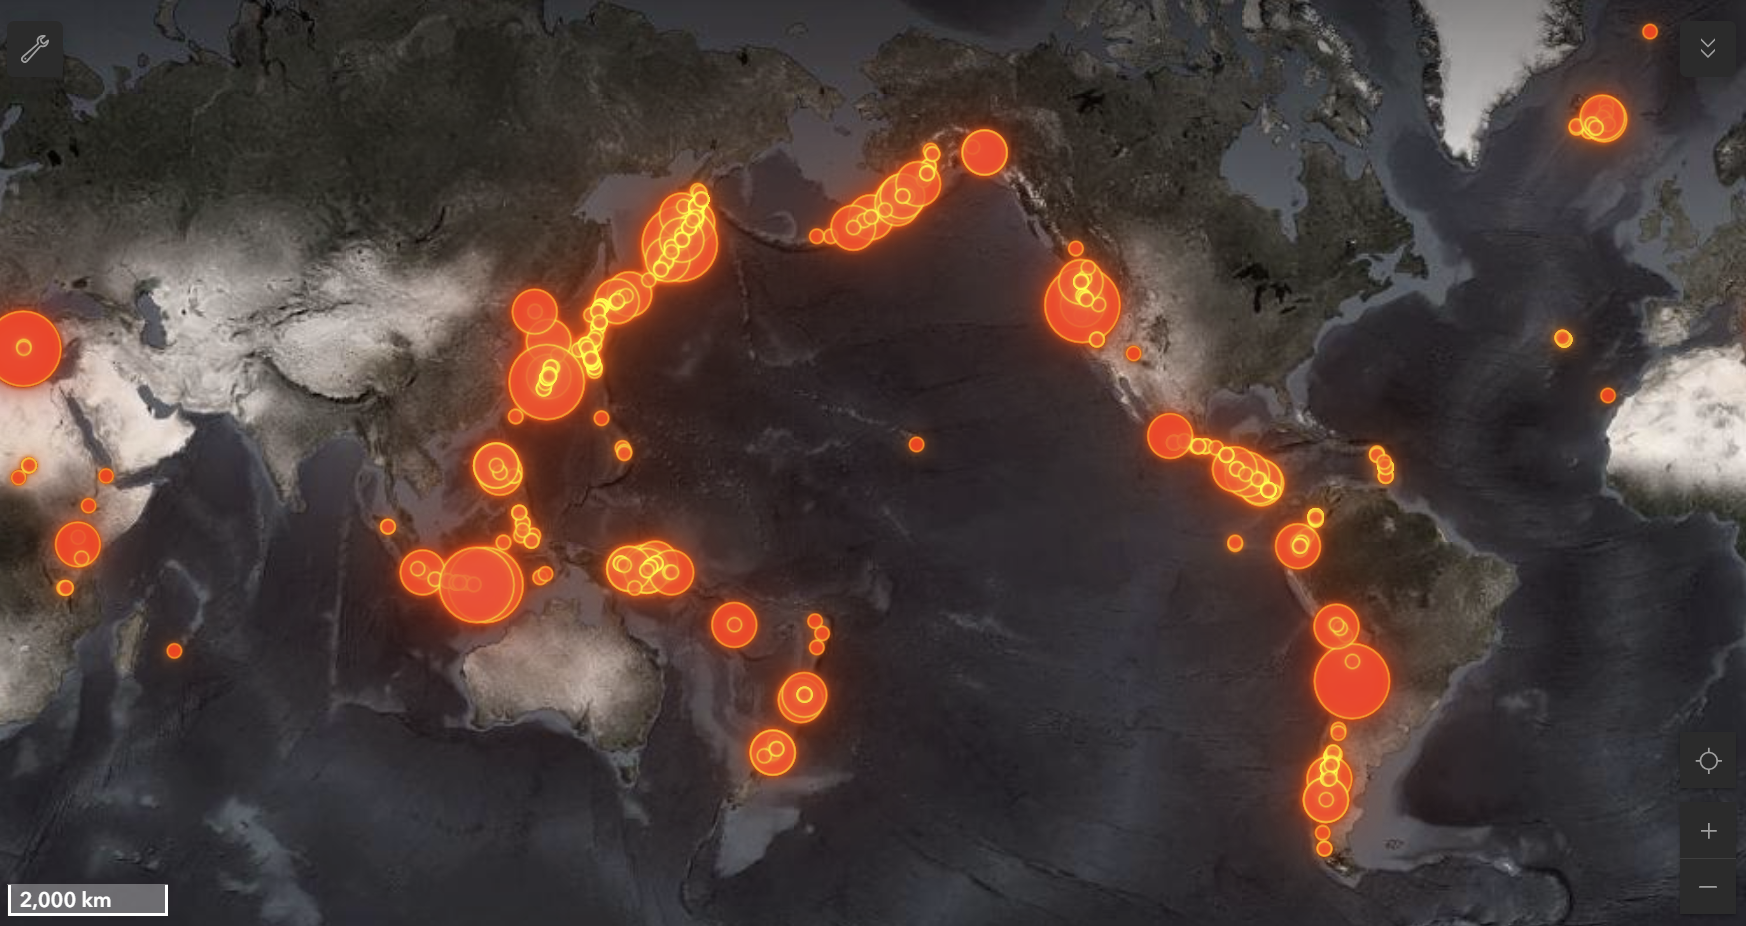
Created and published and ArcGIS Online Web Map showing volcanic eruption data.
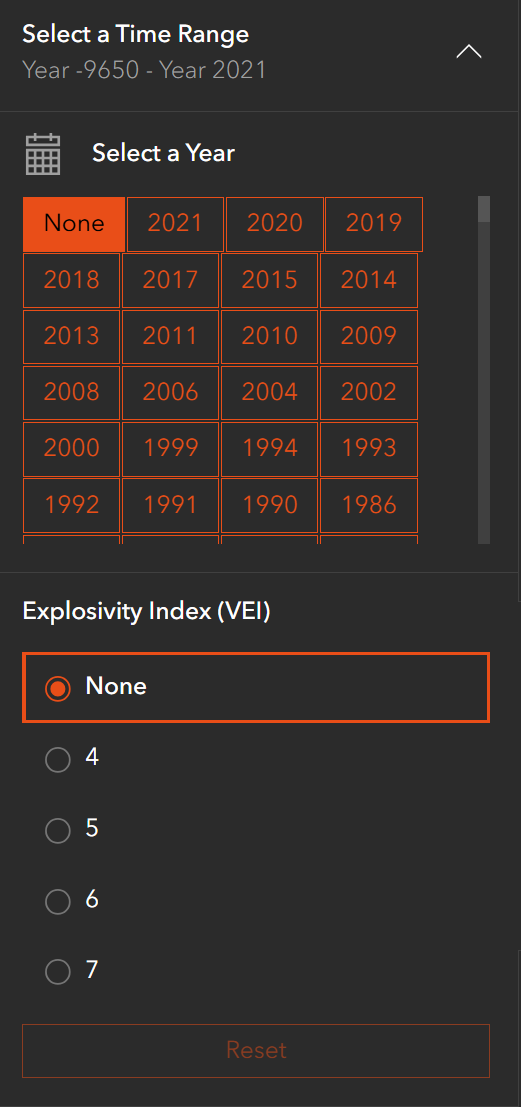
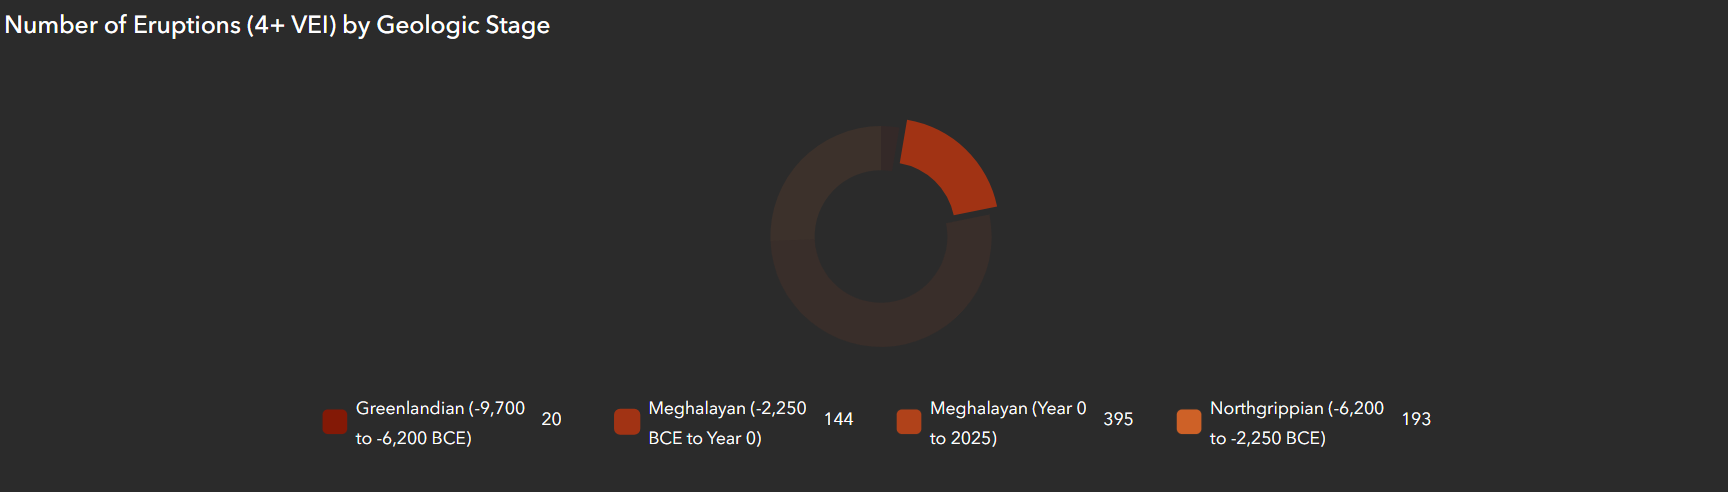
Created an ArcGIS Online Data Dashboard that included the web map and other data visualizations using the same dataset
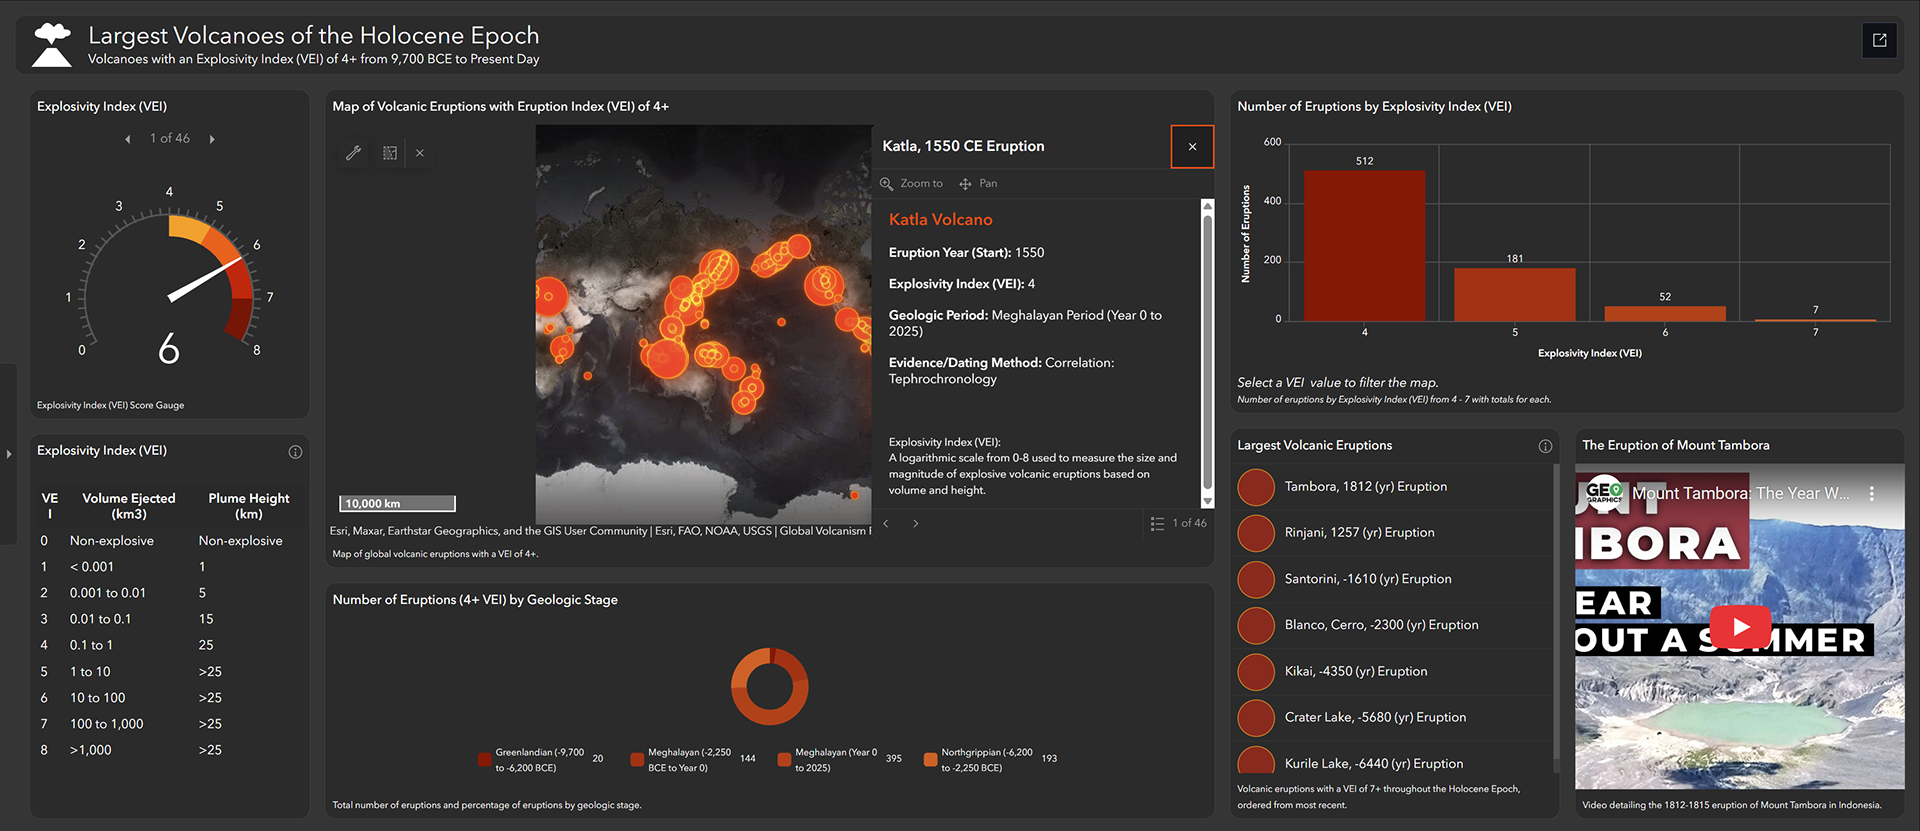
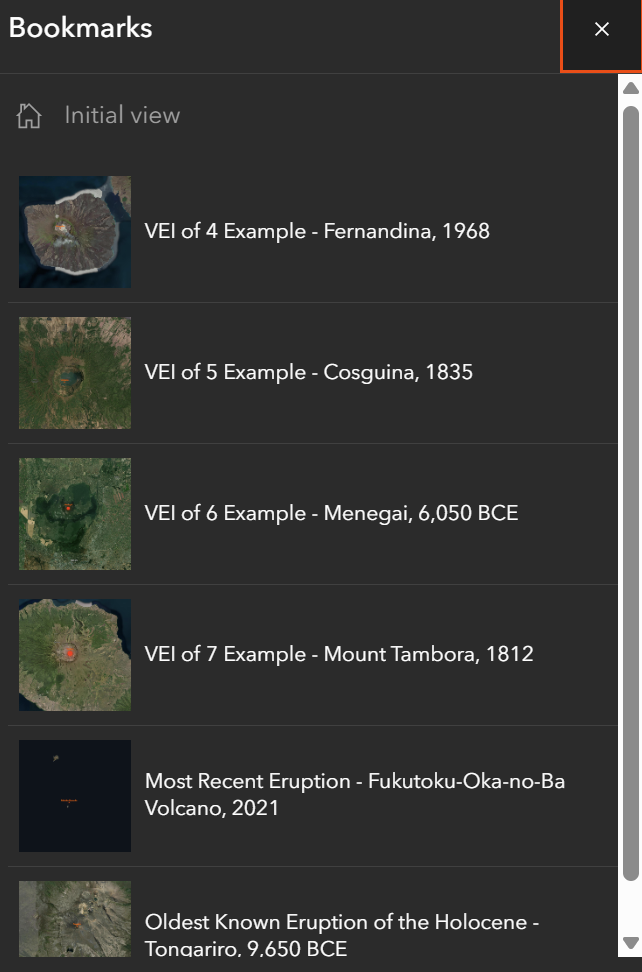
The dashboard included interactive elements such as a list of bookmarks that when clicked would pan and zoom to that location.
Lastly, created an ArcGIS StoryMap to communicate the story of the data and embed the data dashboard within it.